To ensure the highest standards of precision and reliability, inertial sensors are subjected to rigorous testing protocols in controlled environments. These tests are designed to evaluate critical performance metrics, including bias stability, scale factor accuracy, noise characteristics, and dynamic response. By simulating real-world conditions—such as temperature fluctuations, vibration profiles, and motion dynamics—engineers thoroughly validate the sensors’ robustness and precision before field deployment. This data is transformed in a bathymetric map.
This stringent validation process is essential for mission-critical applications across defense, aerospace, and autonomous navigation systems, where even minor deviations can impact operational success. During testing, sensors are evaluated using high-precision reference systems and undergo performance comparisons under varying environmental stressors to ensure consistent accuracy.
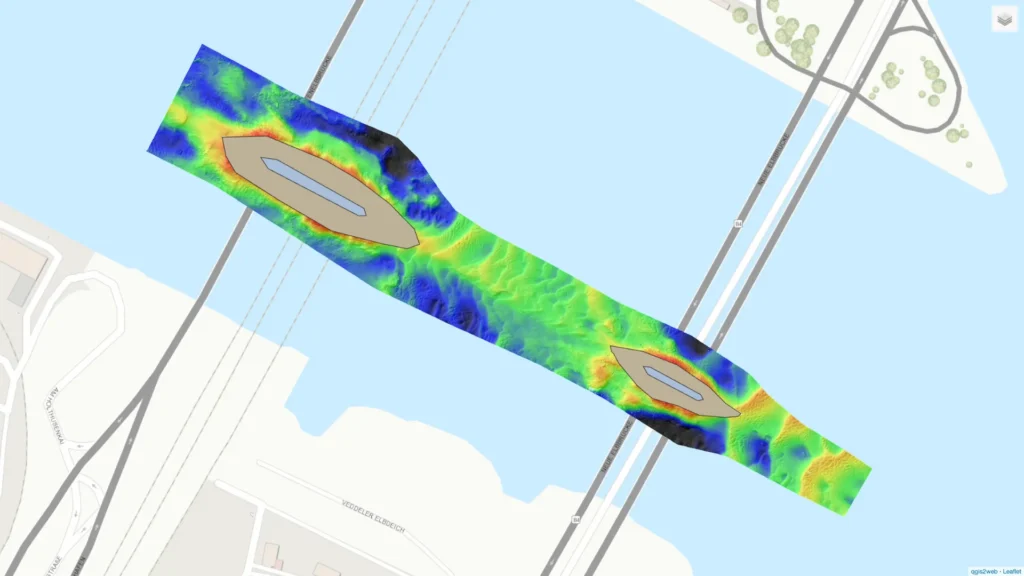
A recent field validation of such testing was conducted along the Elbbrücken bridge pillars in Hamburg, Germany. This campaign focused on mapping the river surface (bathymetric map) of the Elbe River and assessing bathymetric quality using tightly coupled INS/GNSS solutions. The reference dataset was generated using a Horizon system—an advanced, tightly integrated solution known for its high-precision inertial outputs. A high-end fiber-optic gyroscope system was used as the compare sensor, allowing for a direct assessment of sensor response in a real-world hydrographic environment.
3D visualization of the Elbe river
One of the key outcomes of this survey was the creation of a 3D visualization of the Elbe river surface along the Elbbrücken pillars. This webmap includes bathymetric quality measures, difference surfaces, and detailed navigation trajectories, offering a clear comparison between sensor outputs under identical conditions.
We invite researchers, engineers, and industry professionals to explore the 3D bathymetric map visualization of the Elbbrücken area. The webmap provides a valuable insight into how high-end inertial sensors perform when tested against known references in dynamic, real-world scenarios. This visualization not only demonstrates the effectiveness of modern inertial validation practices but also highlights the potential of integrated navigation technologies for high-stakes applications.
How to use the 3D bathymetric map visualization:
1 – One continuous click with 1 finger for a 360º move.
2 – Use trackpad 2 fingers gesture for zoom in/out
3 – Select all features you want to be presented (e.g. colors, survey line, etc.)
Get full access to other SBG Systems’ products test reports.