Our Inertial Navigation Systems have been tested during a three-day lasting hydrographic survey in the Hamburg (Germany) port area. SBG Systems and MacArtney Germany GmbH equipped a survey vessel with a complete Multibeam Echosounder survey configuration and conducted various tests to show the performance of the SBG Inertial Systems in different challenging environments. Explore our marine bathymetric test.
Test conditions
Initially, raw INS data were logged in real-time and merged with MBES data from the RESON SeaBat 7125 within the acquisition software Teledyne PDS. Subsequently, hydrographic data were post-processed and filtered with BeamWorx AutoClean.
Additionally, INS data have been processed using SBG PPK Software Qinertia. Finally, the reference is the tightly coupled Horizon high-end fiber optic solution.
We thank MacArtney Germany for their help in this marine bathymetric test.
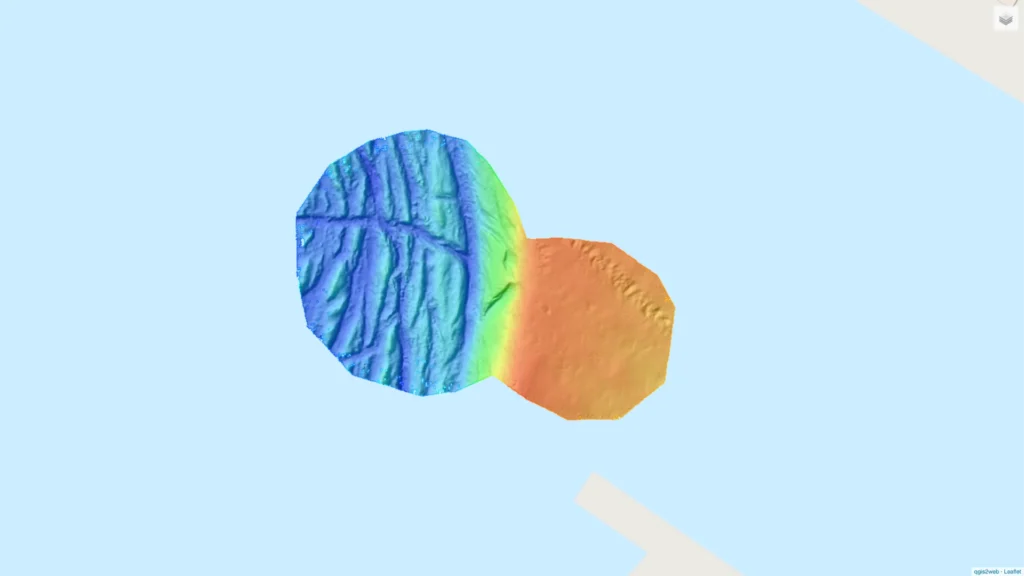
Marine bathymetric test calibration procedure
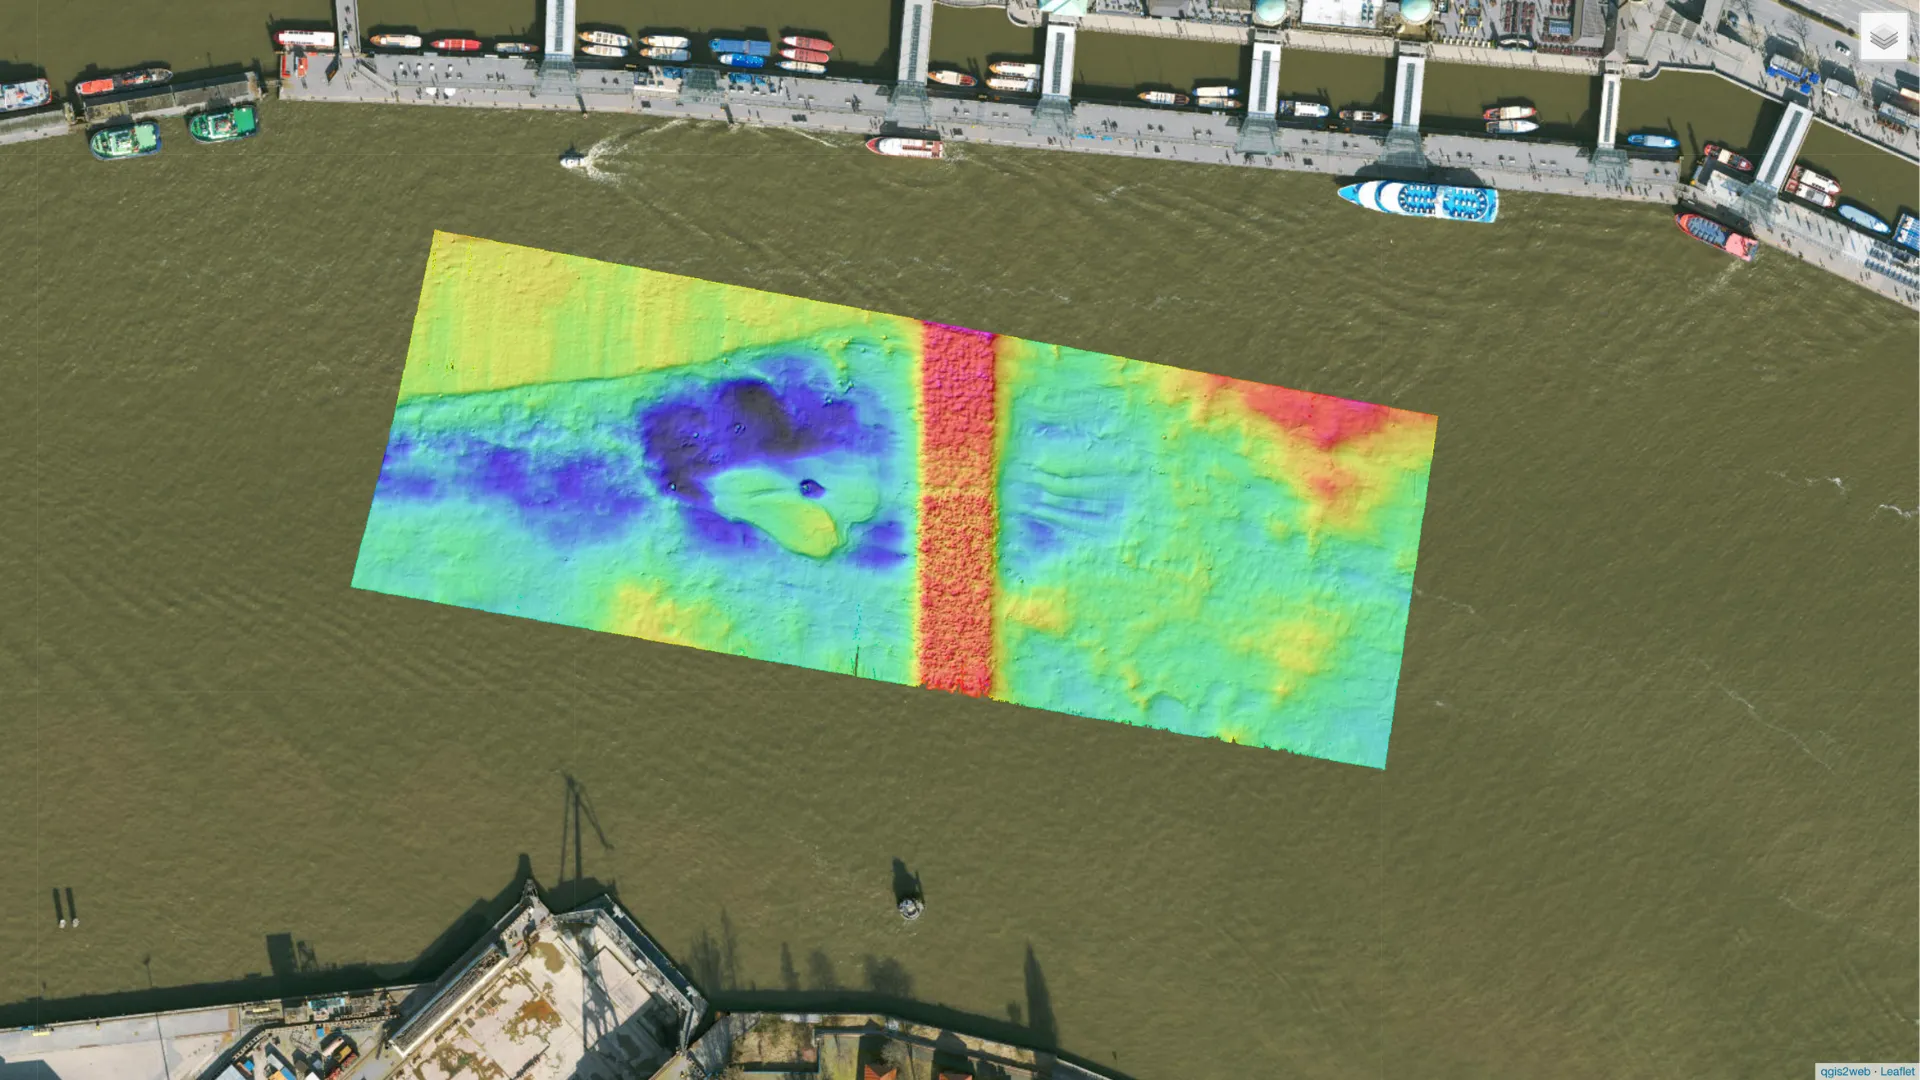
Calibration based on motion and trajectory data of the SBG Horizon during the marine bathymetric test.
The interface includes the survey line, the computed bathymetry, quality indicating layers and topographic features.
Calibration reports and results
SBG Inertial Navigation Systems underwent testing during a three-day hydrographic survey in Hamburg, Germany. Additionally, SBG Systems and MacArtney Germany GmbH equipped a survey vessel with a complete Multibeam Echosounder configuration to assess INS performance in challenging conditions.
The tested sensors included Horizon, Apogee, Ekinox (Navsight Marine Series), and Ellipse. The team logged raw INS data in real-time and merged it with MBES data from the Reson SeaBat 725 using Teledyne PDS.
Subsequently, they post-processed and filtered hydrographic data with Beam Worx AutoClean, while Qinertia handled INS data processing. Furthermore, GIS software generated 3D models and interactive web maps, displaying INS-based bathymetric computations and quality layers. JavaScript was used to format layouts. The evaluation covered calibration results, bathymetric data, trajectories, and quality indicators, focusing on motion and positioning performance.
Each marine bathymetric test, included under-bridge and channel surveys with GNSS outages and operations in strong swells. Moreover, the study analyzed survey improvements from loosely and tightly coupled post-processing of raw INS logs.
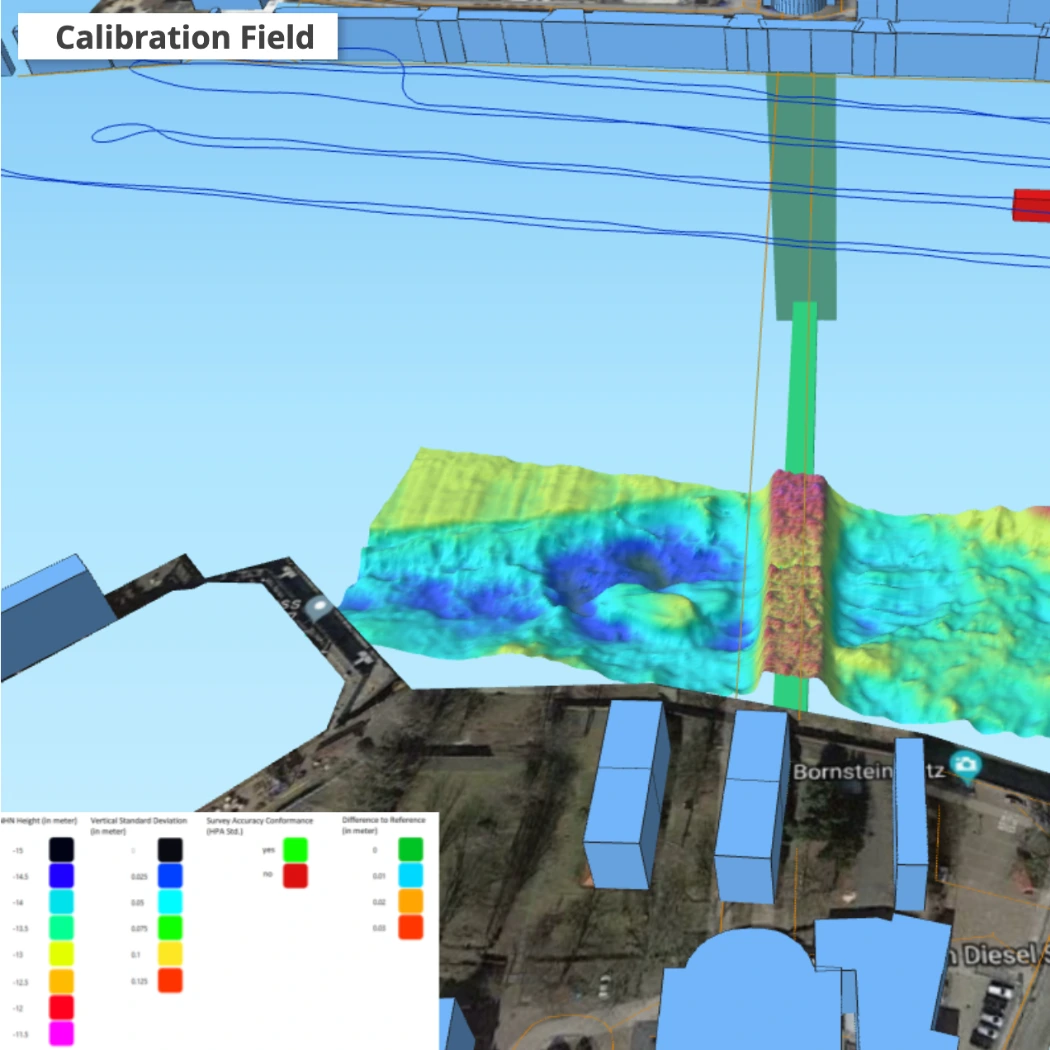
1 – Motion sensor calibration field
Ensuring high precision in motion sensing starts with rigorous calibration. Our inertial sensors undergo extensive testing to correct biases, scale factors, and misalignments. Using advanced multi-axis platforms and controlled environments, this process enhances sensor accuracy and stability across a wide range of operational conditions. By fine-tuning each sensor’s response, calibration ensures reliable performance in demanding applications such as aerospace, marine, and autonomous navigation.
3D Model
3D Visualization of the survey area for the motion sensor calibration, based on motion and trajectory data of the SBG Horizon. The interface includes the survey line, the computed bathymetry, quality indicating layers and topographic features.
3D survey map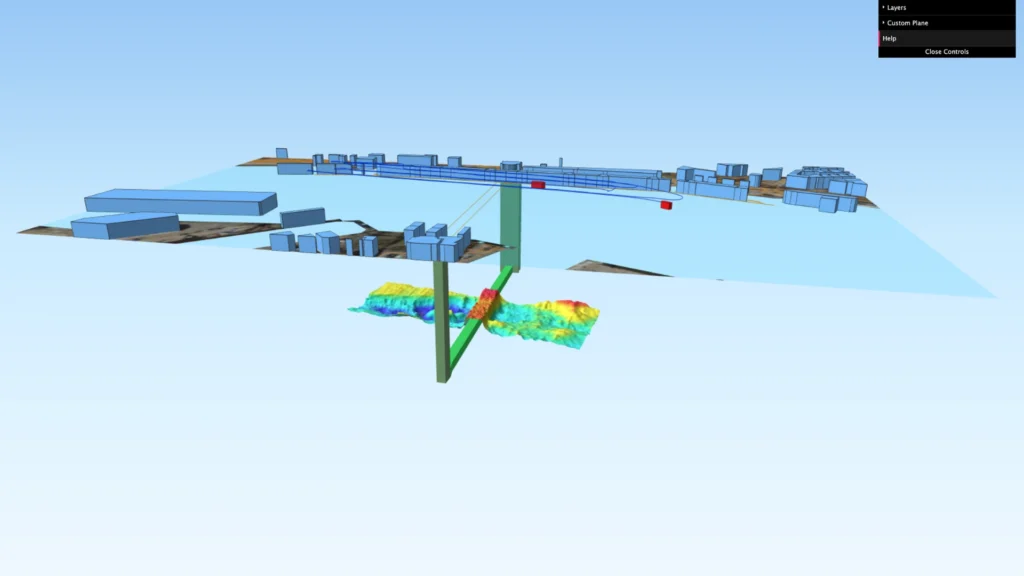
Calibration reports/offsets
Calibration reports and advised mounting angles for each SBG Inertial System. The Patching software BeamworX Autopatch generates all these reports. During an alignment survey, the team measured the offsets for each sensor based on the vessel configuration and sensor setup, then evaluated them using Cremer Caplan.
Precise Point Positioning test
Test of the new PPP processing mode in Qinertia. Bathymetric surfaces and quality layers have been computed on basis of RTK (real-time) and PPP (post-processing) INS solutions.
2 – Inertial tests
Inertial sensors undergo rigorous testing in controlled environments to ensure high precision and reliability. These tests evaluate key performance metrics such as bias stability, scale factor accuracy, noise levels, and dynamic response. By simulating real-world conditions, including temperature variations and vibration profiles, engineers validate the sensor’s resilience and accuracy. Ultimately, through extensive inertial testing, manufacturers guarantee optimal performance for mission-critical applications in defense, aerospace, and autonomous systems.
Elbbrücken webmap
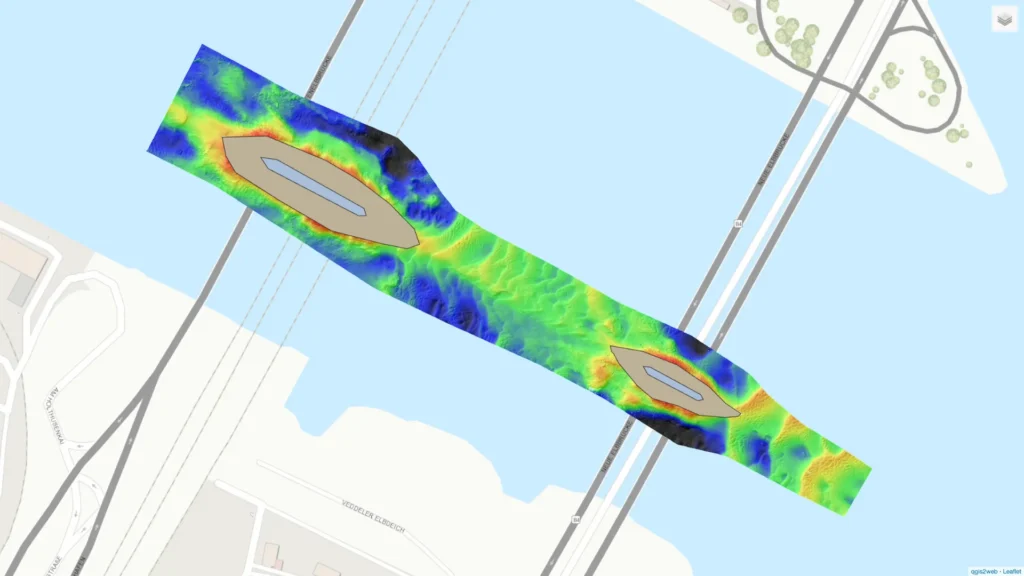
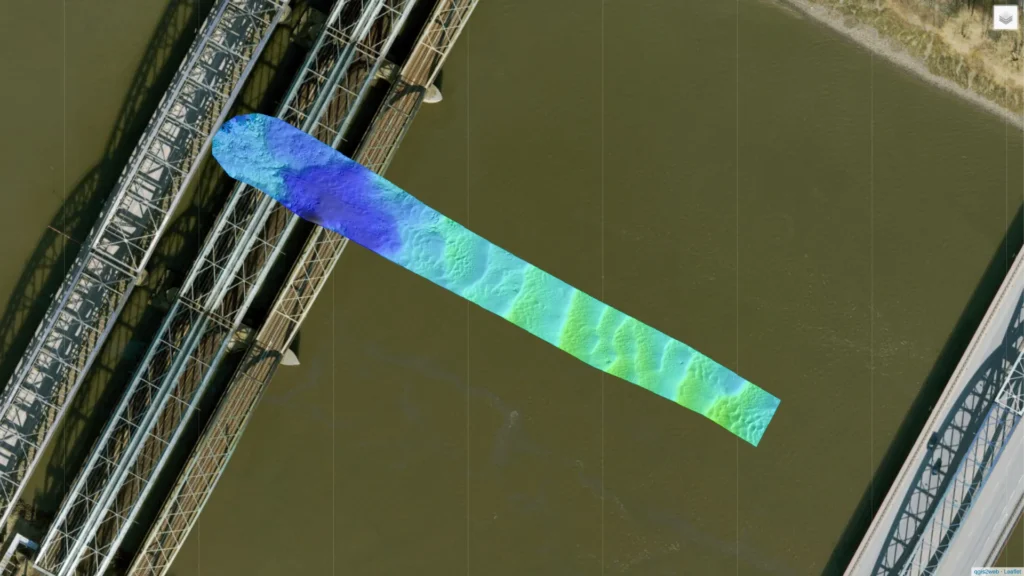
Webmap of the river surface of the Elbe along the pillars of the Elbbrücken and bathymetric quality measures plus trajectories. Reference for the Difference surfaces is a tightly coupled Horizon solution. The compare sensor is a high-end fiber-optic system.
Elbbrücken 3D model
3D Visualization of the Bathymetry below the Elbbrücken in Hamburg, based on trajectory data of the SBG Horizon. The interface includes the survey line, the computed bathymetry, quality indicating layers and topographic features.
Elbbrücken 3D model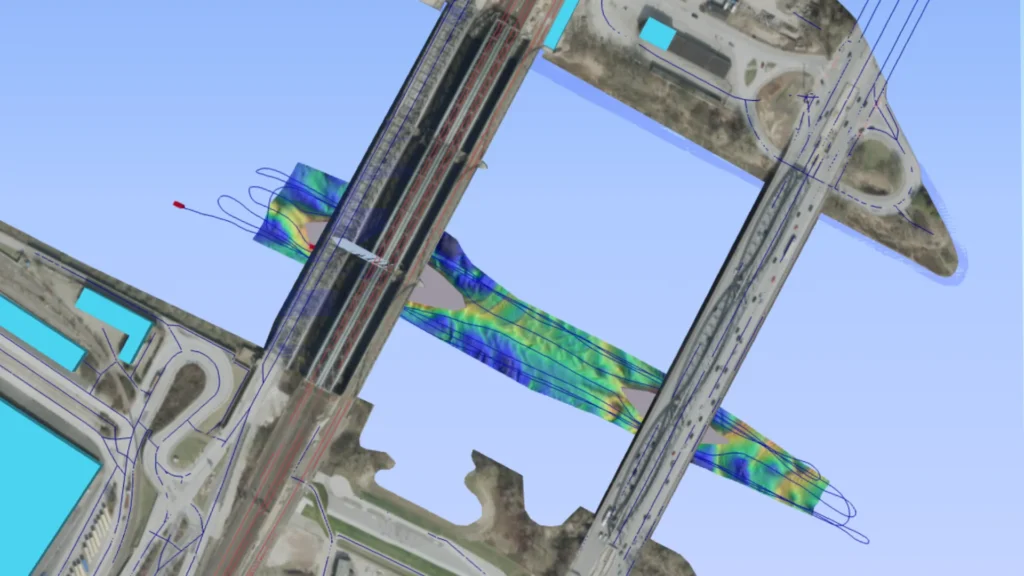
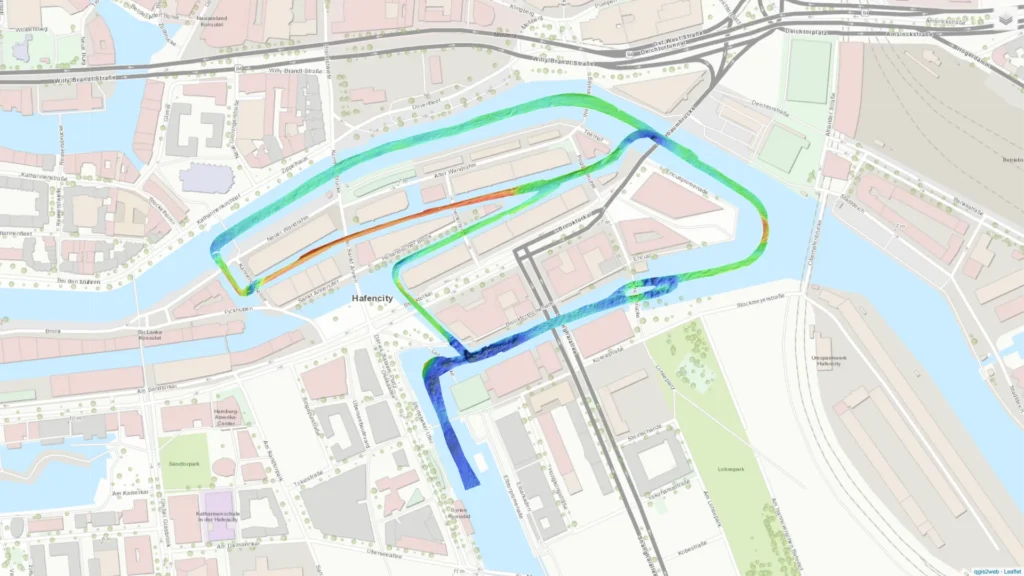
Speicherstadt webmap
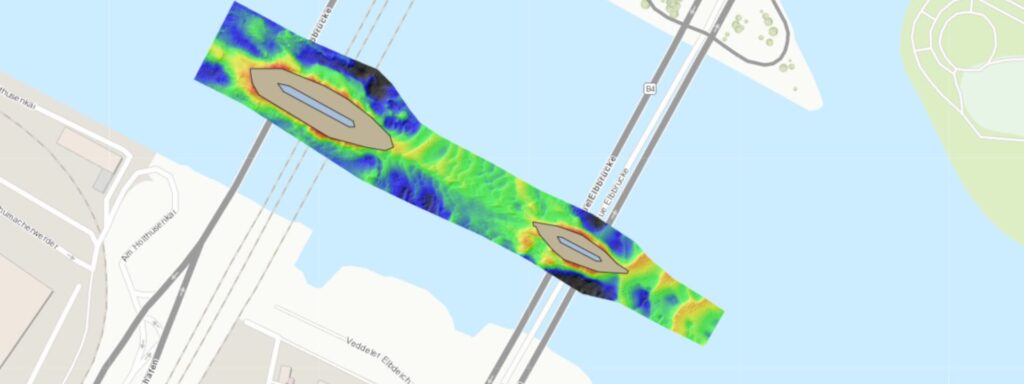
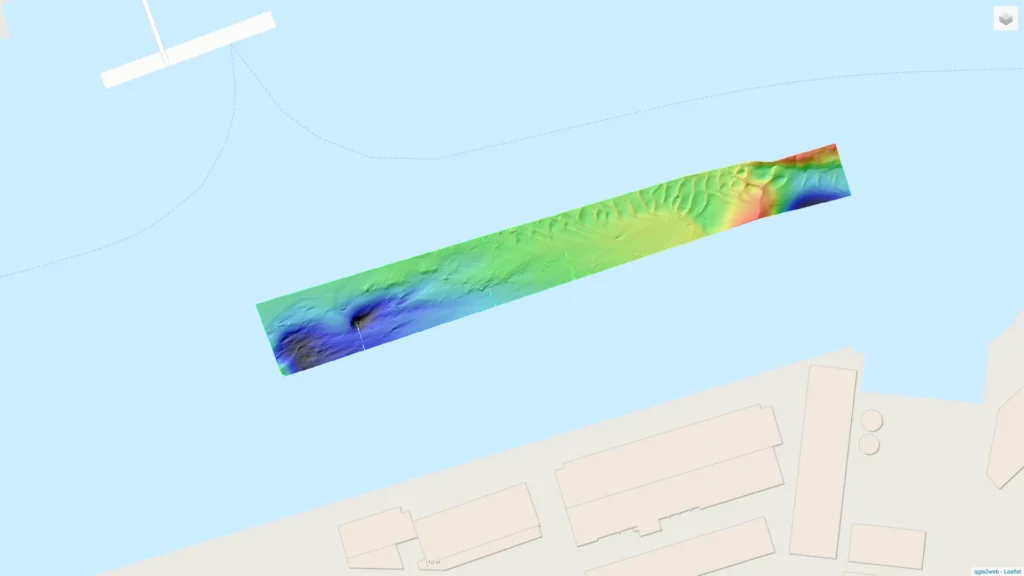
Webmap of the river surface of the Elbe along the channels of the Speicherstadt and bathymetric quality measures, plus trajectories. Reference for the Difference surfaces is a tightly coupled Horizon solution. The compare sensor is a high-end fibre-optic system.
Channels of Speicherstadt bathymetric 3D model
3D Visualization of the Bathymetry along the channels of the Speicherstadt, based on trajectory data of the SBG Horizon. The interface includes the survey line, the computed bathymetry, quality indicating layers and topographic features.
Speicherstadt 3D model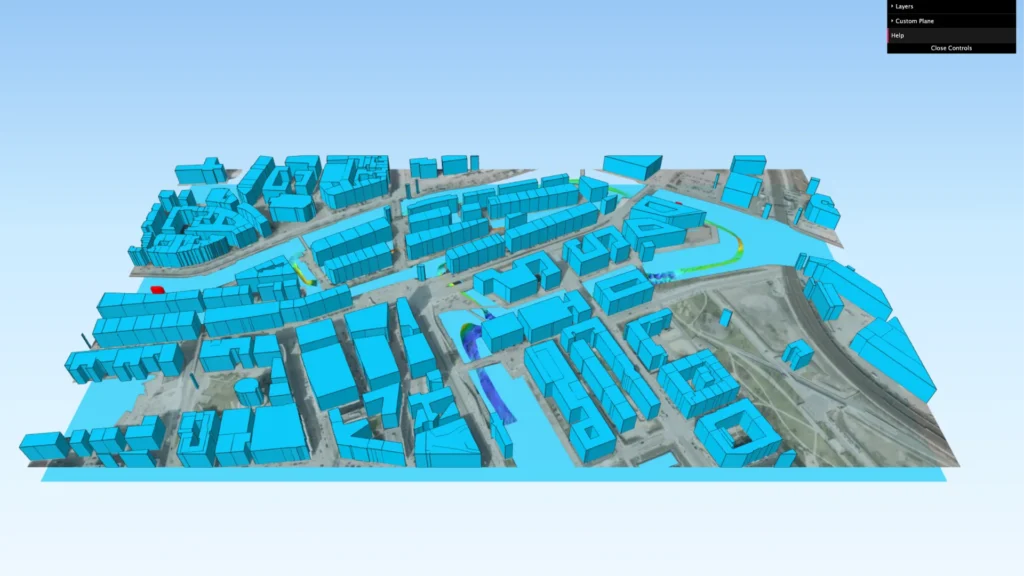
Underbridge 180° turn webmap
Webmap of the river surface of the Elbe along the Elbbrücken and bathymetric quality measures plus trajectories. The survey contains a full 180° turn during a complete RTK outage. Reference for the Difference surfaces and the compare system is a post-processed fiber-optic sensor solution.
3 – Motion tests
These tests simulate real-world dynamics, evaluating performance in varying conditions such as rapid accelerations, vibrations, and rotational movements. By analyzing sensor responses, we refine calibration and compensation algorithms to optimize precision in the most demanding applications.
Hamburg docks webmap
Webmap of the river surface of the Elbe next to the Docks of the Hamburg Harbour and bathymetric quality measures plus trajectory. During this test dynamic motion patterns, due to swells induced by ships passing the vessel, have been recorded. Reference for the Difference surfaces is a real-time fibre-optic sensor solution.
Hamburg docks 3D model
3D Visualization of the Bathymetry of the Elbe next to the Docks of the Hamburg Harbour, based on trajectory data of the SBG Horizon. The interface includes the survey line, the computed bathymetry, quality indicating layers and topographic features.
Hamburg harbour webmap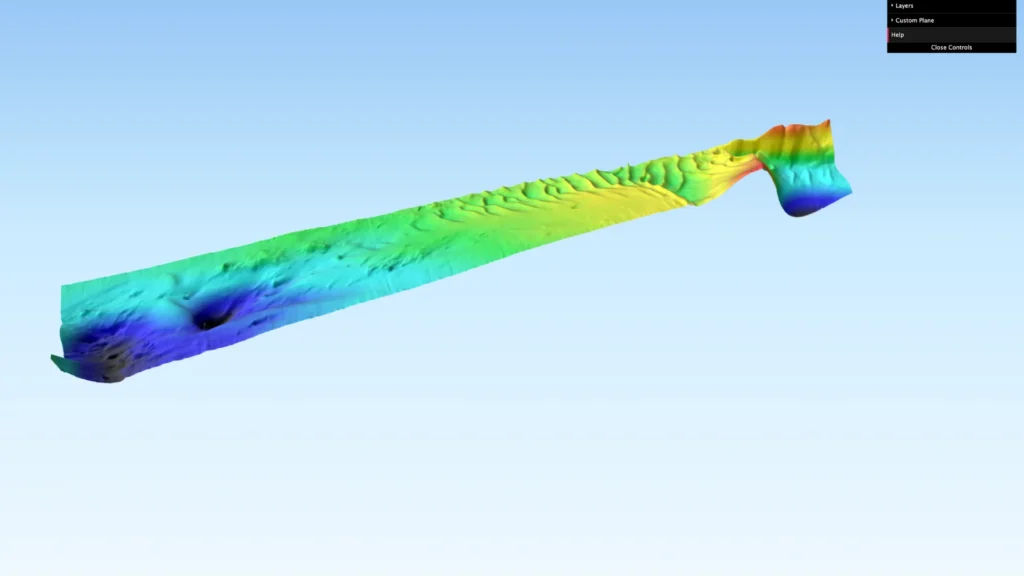
8 Figure heading webmap
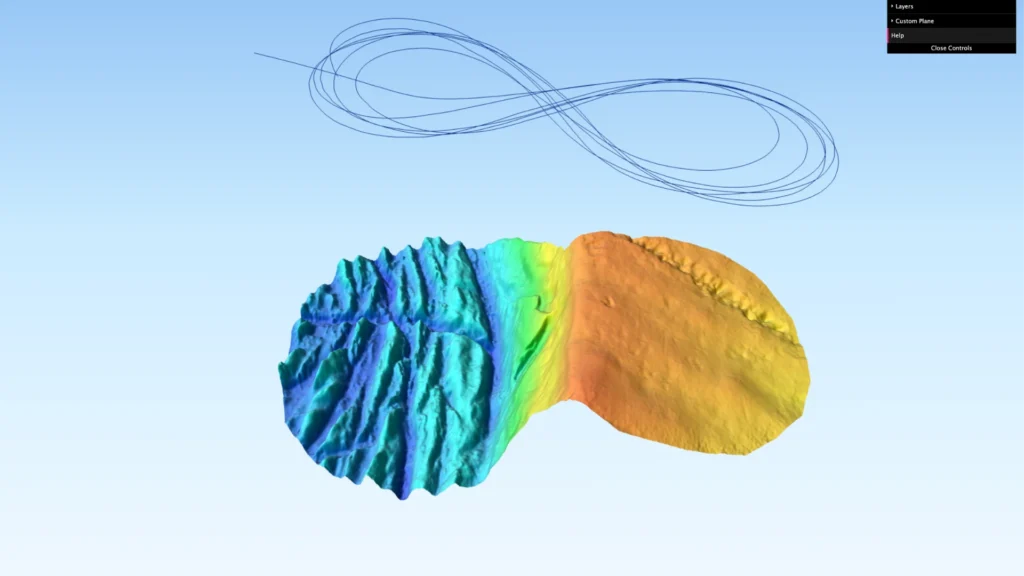
Webmap of the river surface of the Elbe during an 8 Figure manoeuvre and bathymetric quality measures plus trajectory. This manoeuvre is conditioning especially regarding the heading performance of the sensors during a marine bathymetric test. Reference for the Difference surfaces is a real-time fiber-optic sensor solution.
8 Figure heading 3D model
3D Visualization of the Bathymetry of the Elbe during an 8 Figure manoeuvre, based on trajectory data of the SBG Horizon. The interface includes the survey line, the computed bathymetry, quality indicating layers and topographic features.
3D survey model webmap