SBG Systems recently conducted a dedicated test campaign to evaluate the new Precise Point Positioning (PPP) processing mode available in Qinertia GNSS/INS, its powerful post-processing software. This test compared the performance of real-time RTK solutions with post-processed PPP outputs in a dynamic marine environment, focusing on bathymetric mapping accuracy and data consistency.
The objective was to assess how PPP—without the need for local base stations or real-time corrections—could match or even exceed the quality of traditional RTK workflows. During the campaign, navigation data was collected using a high-performance Inertial Navigation System (INS) integrated with a Multibeam Echosounder (MBES). The data was then processed in Qinertia using both real-time RTK corrections and the new PPP mode.
From these processed datasets, bathymetric surfaces and quality layers were generated to compare the vertical and horizontal consistency of both solutions. The PPP solution demonstrated exceptional precision, delivering results nearly equivalent to the RTK data—confirming PPP as a reliable alternative, especially in remote or GNSS-challenged environments.
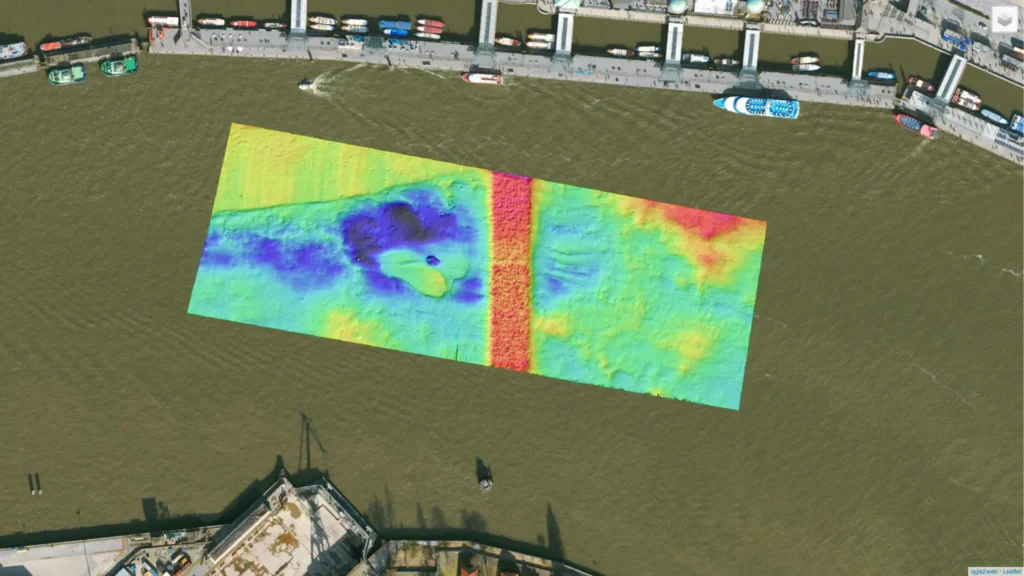
3D visualization of the survey area
One of the key deliverables of the test was the creation of a 3D visualization of the survey area, based on the PPP solution. This interactive map provides a clear view of the underwater topography and highlights the level of accuracy achievable through post-processing alone.
We invite hydrographers, marine surveyors, and GNSS professionals to explore this 3D visualization and analyze the precise output obtained through PPP processing in Qinertia. The comparison with RTK-based surfaces serves as a compelling demonstration of how advanced post-processing techniques can streamline workflows and ensure data integrity—even without a real-time correction infrastructure.
This test reinforces SBG Systems’ commitment to innovation and precision in inertial navigation and post-processing technologies, offering powerful tools that meet the evolving needs of the hydrographic and geospatial industries.
How to use the 3D Survey visualization:
1 – One continuous click with 1 finger for a 360º move.
2 – Use trackpad 2 fingers gesture for zoom in/out
3 – Select all features you want to be presented (e.g. colors, survey line, etc.)
Get full access to other SBG Systems’ products test reports.